SAP Analytics Cloud was a key focus of SAPPHIRENOW 2018. Let's give it a quick test drive using its free trial offering.
In my recent blog What’s new in SAP SuccessFactors HCM reporting, I explained how SAP has declared the SAP Analytics Cloud (SAC) as their future for reporting and analytics leveraging intelligence.
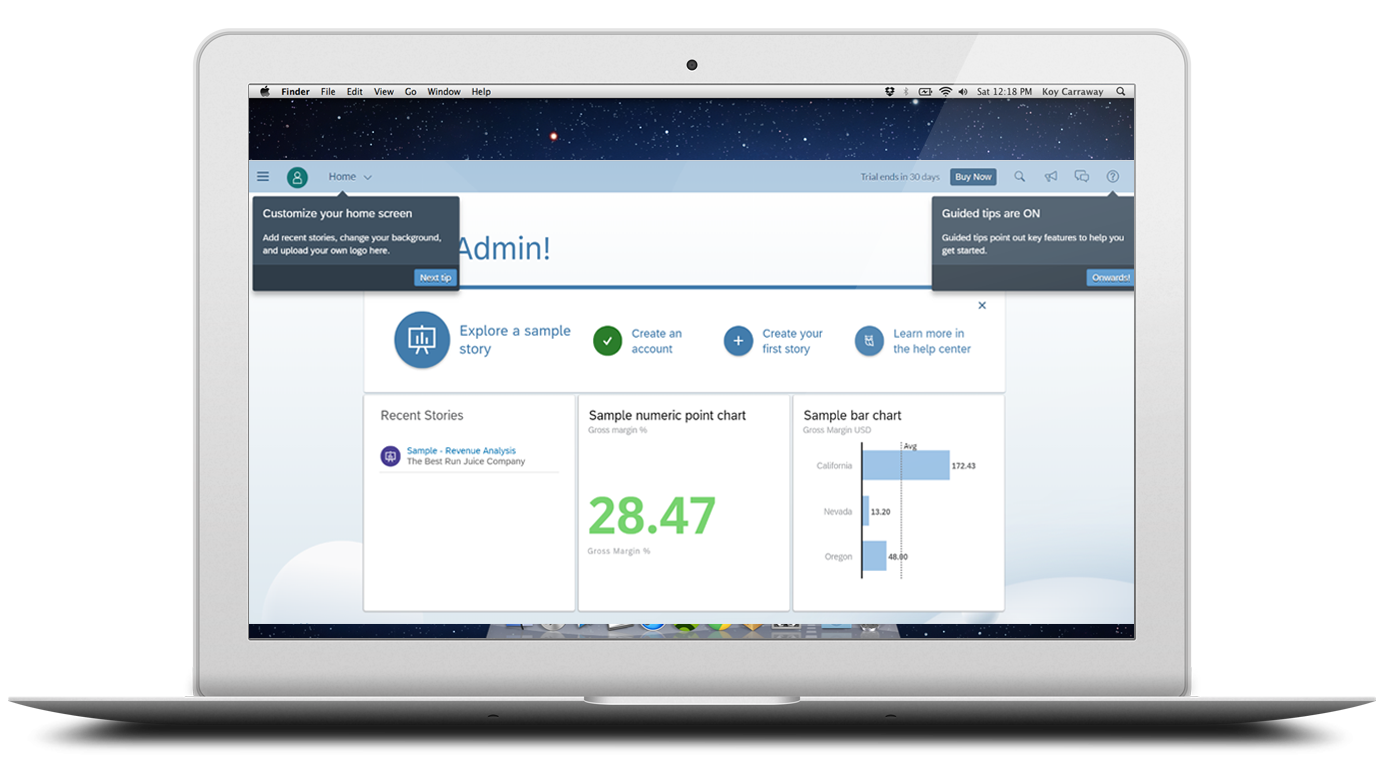
I was excited about what I saw and decided to take advantage of the free 30-day trial of SAP Analytics Cloud. Getting started was easy; all I needed was a valid email address, and I was able to create my own password.
Screenshot from SAP.com 2018
I began by selecting to explore a sample story, and I was presented with a dashboard like the one shown below leveraging data from a fictional beverage company.
Screenshot from SAP.com 2018
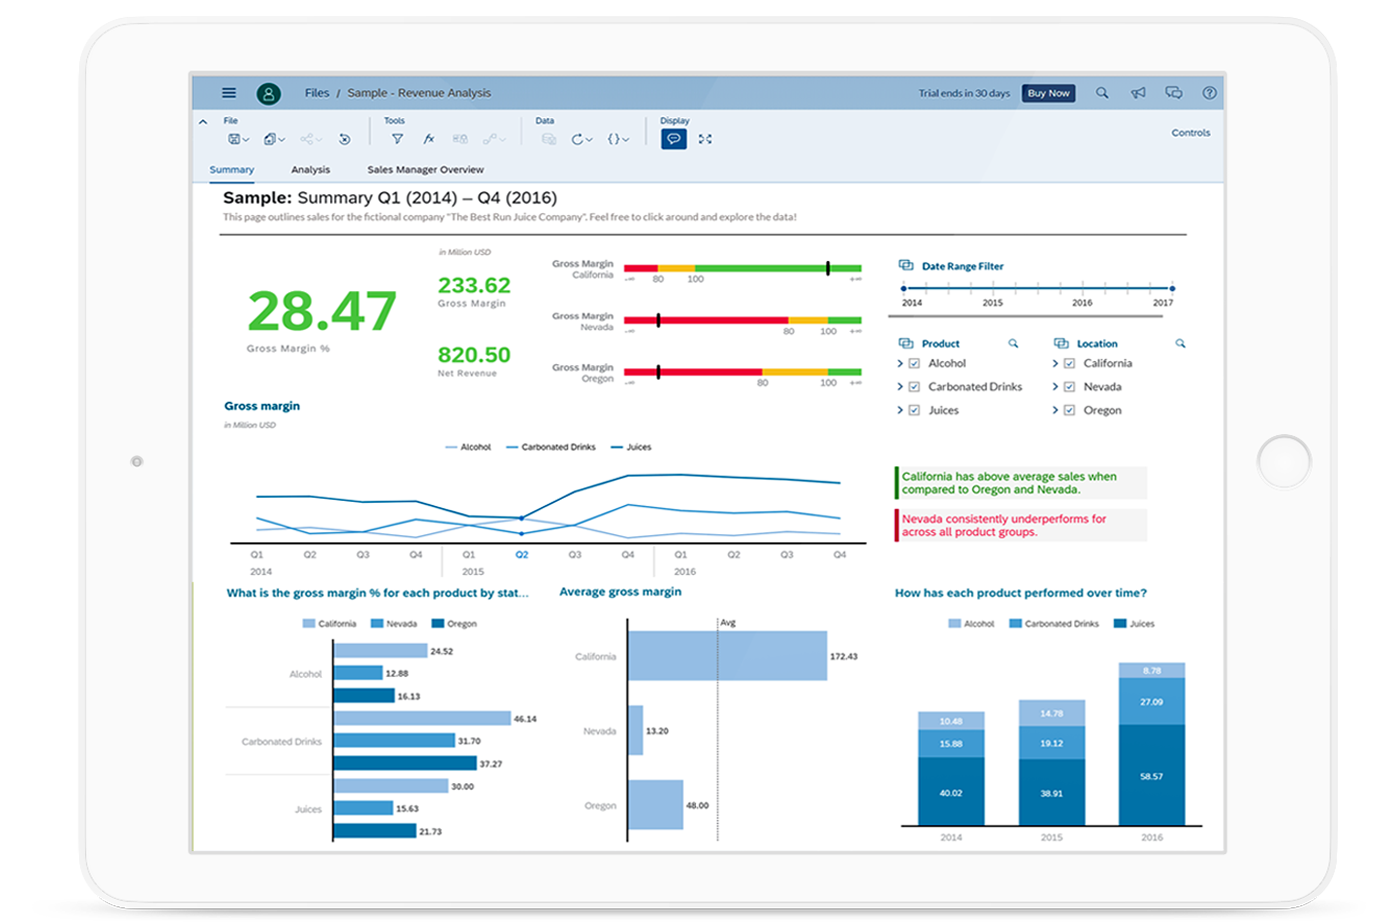
Some things that caught my eye right from the start include the insights declared via intelligence, like the one that states how “Nevada consistently underperforms across all product regions”. These insights are in line with the intelligent shift of taking the onus off the analyst looking at the data to draw their own conclusions and rather assisting them in analysis of the data and sharing key conclusions.
As mentioned in my previous blog, SAC provides the ability to gather meaningful information from across SuccessFactors and use that information in a way to tell a compelling story that is ready for the business to make decisions from.
Before Intelligence -> The dashboard would show a chart labeled Headcount and the user could drill into it to review it and try to ascertain patterns, look for outliers etc.
After Intelligence -> The Dashboard highlights a business consideration insight, such as “How are we hiring by Ethnicity?” or “how California has above average sales…” as shown in the graphic above.
Interacting with my dashboard was easy. On the right-hand side of the screen, there is a Date Range Filter that allowed me to vary my content view based on a sliding scale. In addition, I had an interactive legend that allows me to specify what data I would like included. In my fictional beverage company example, I unmarked the options for both Alcohol and Nevada (as I made some assumptions there, if you know what I mean) to see the immediate impact on my data and its analysis. Turns out alcohol sales in Nevada were not a large contributor (clearly fictional data).
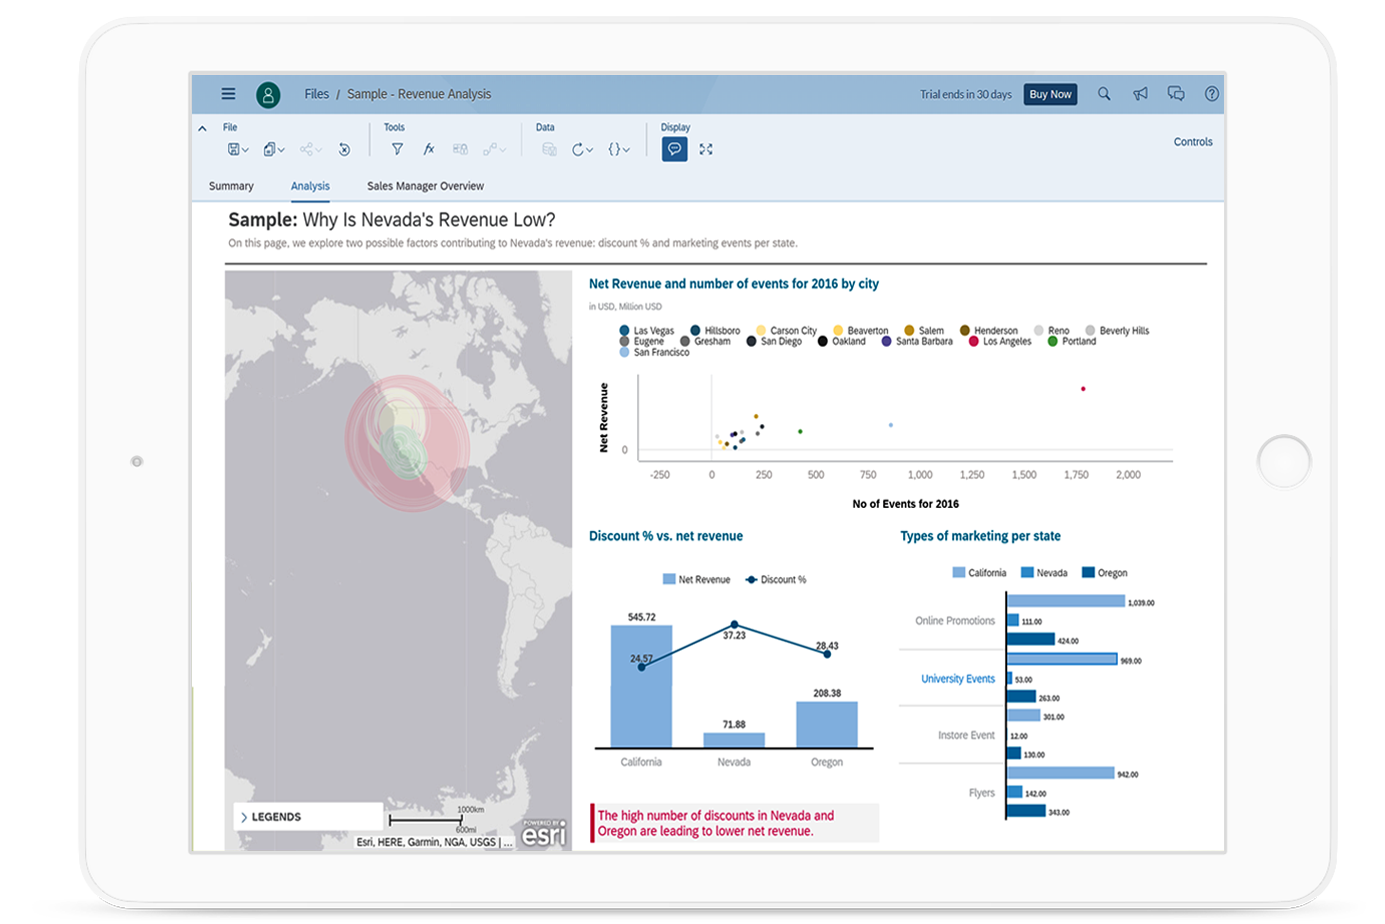
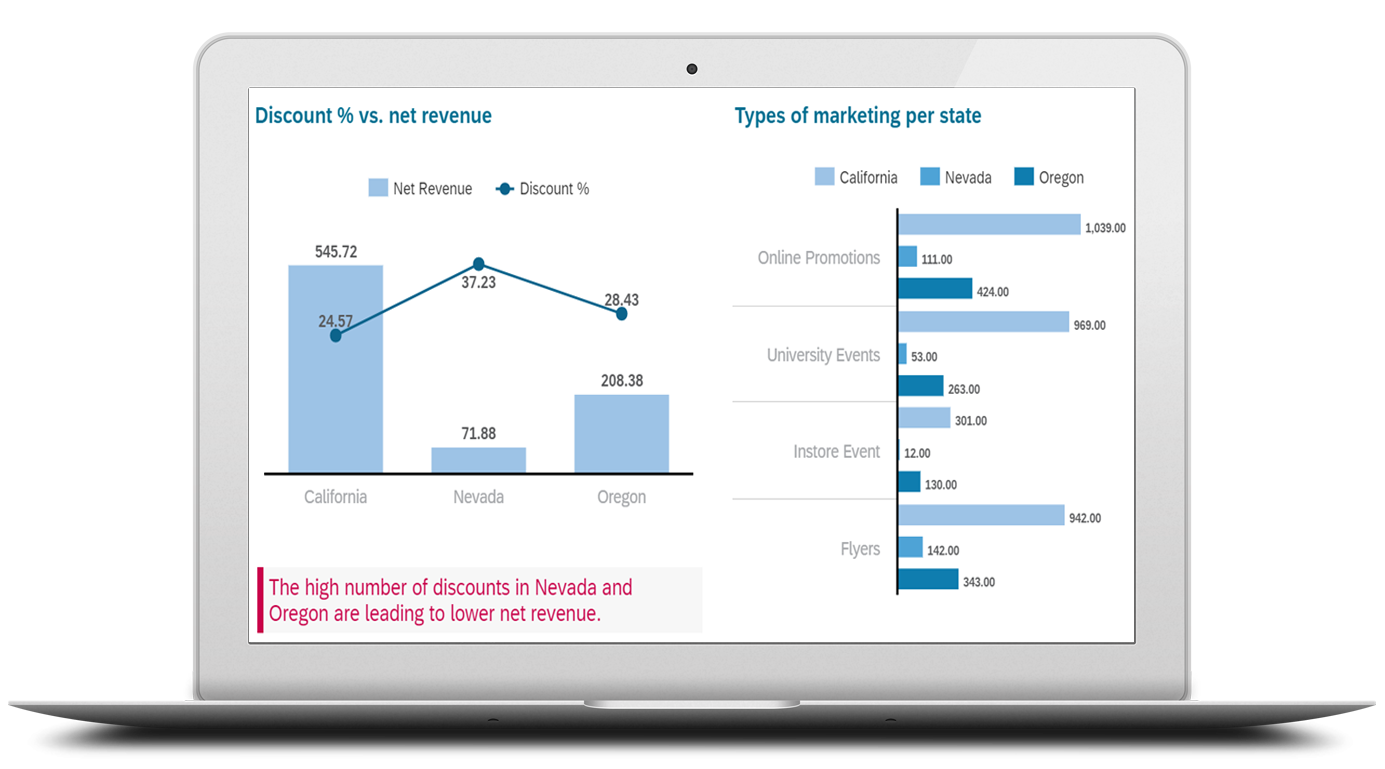
Next, I used the top navigation to select the Summary View which brought me to a screen that was one step ahead of me by estimating why sales in Nevada were so low, as shown below:
 Screenshot from SAP.com 2018
This intelligence is the cornerstone of SAP Analytics Cloud. As I reviewed the analysis I was excited to interact with the interactive geo-map to scroll into the hot areas of revenue as shown below:
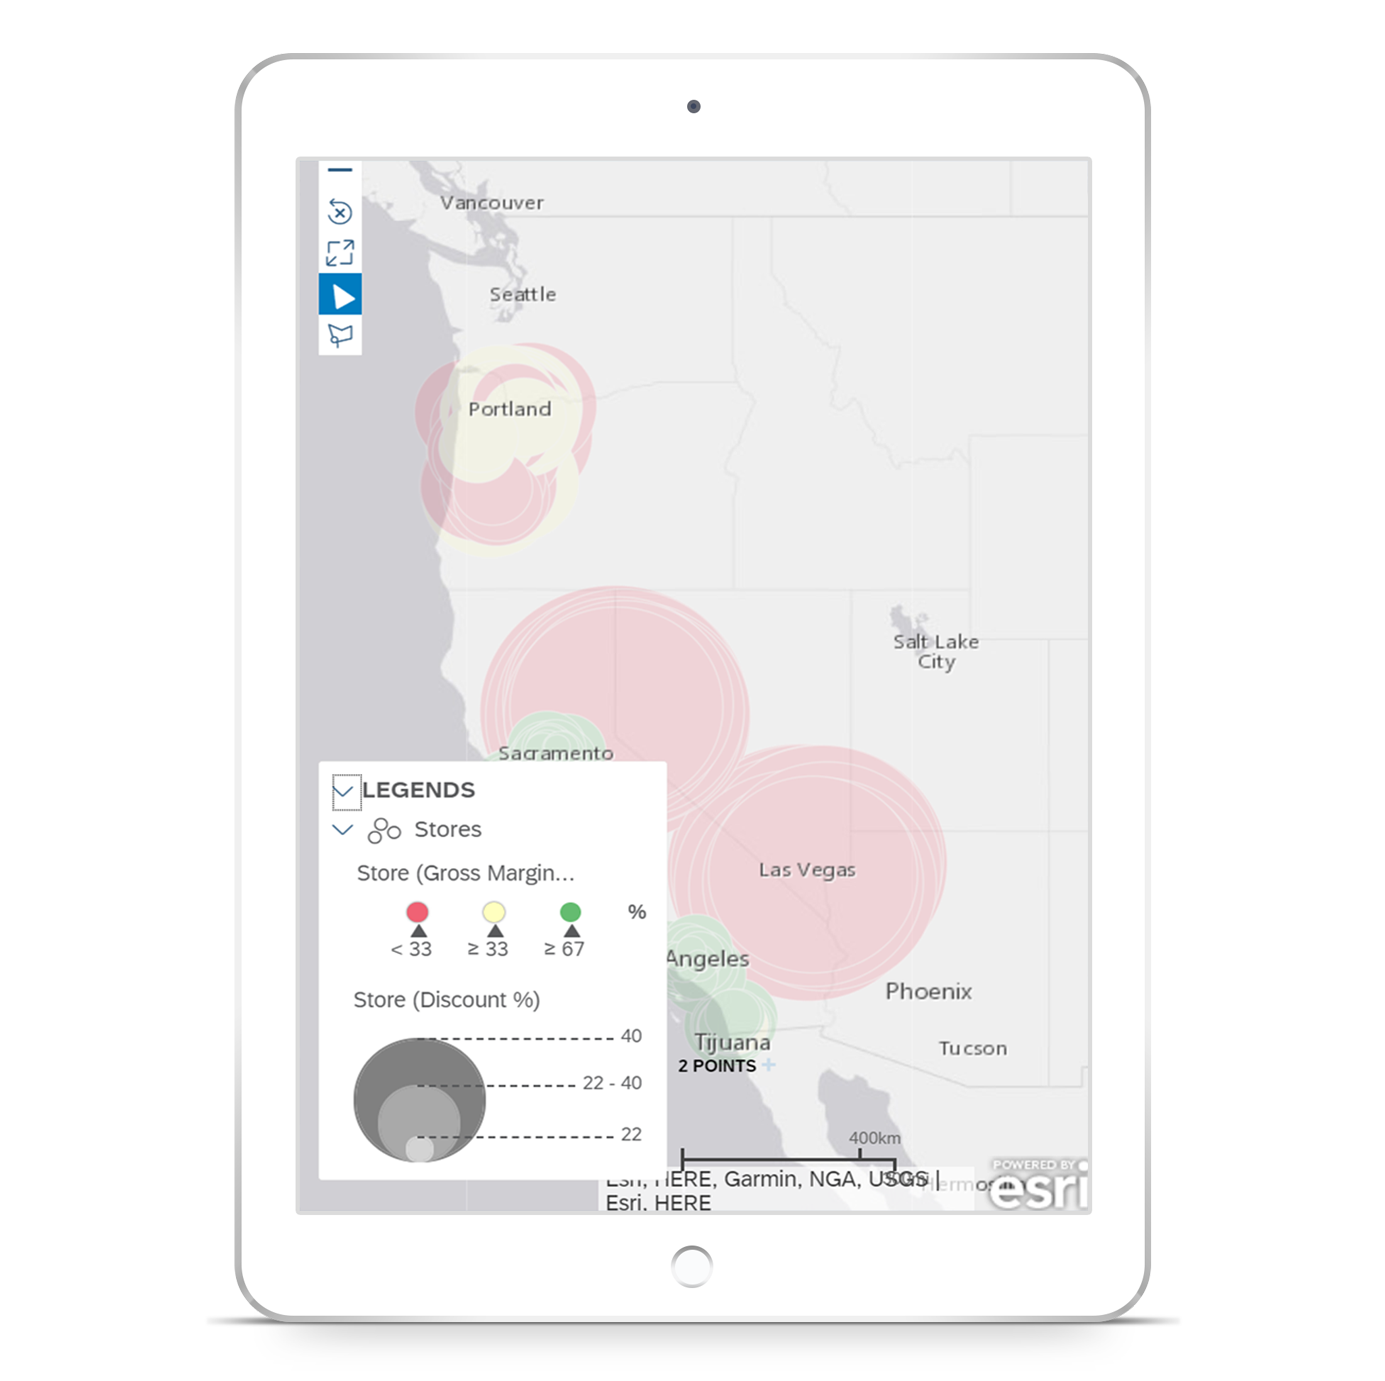 Screenshot from SAP.com 2018
Because SAC has access to all relative data, it has proposed two possible analyses for why the revenue was so low: Discounting, and lack of marketing events in the region, as shown below:
Screenshot from SAP.com 2018
Next, I navigated to the Sales Manager Overview view as shown below:
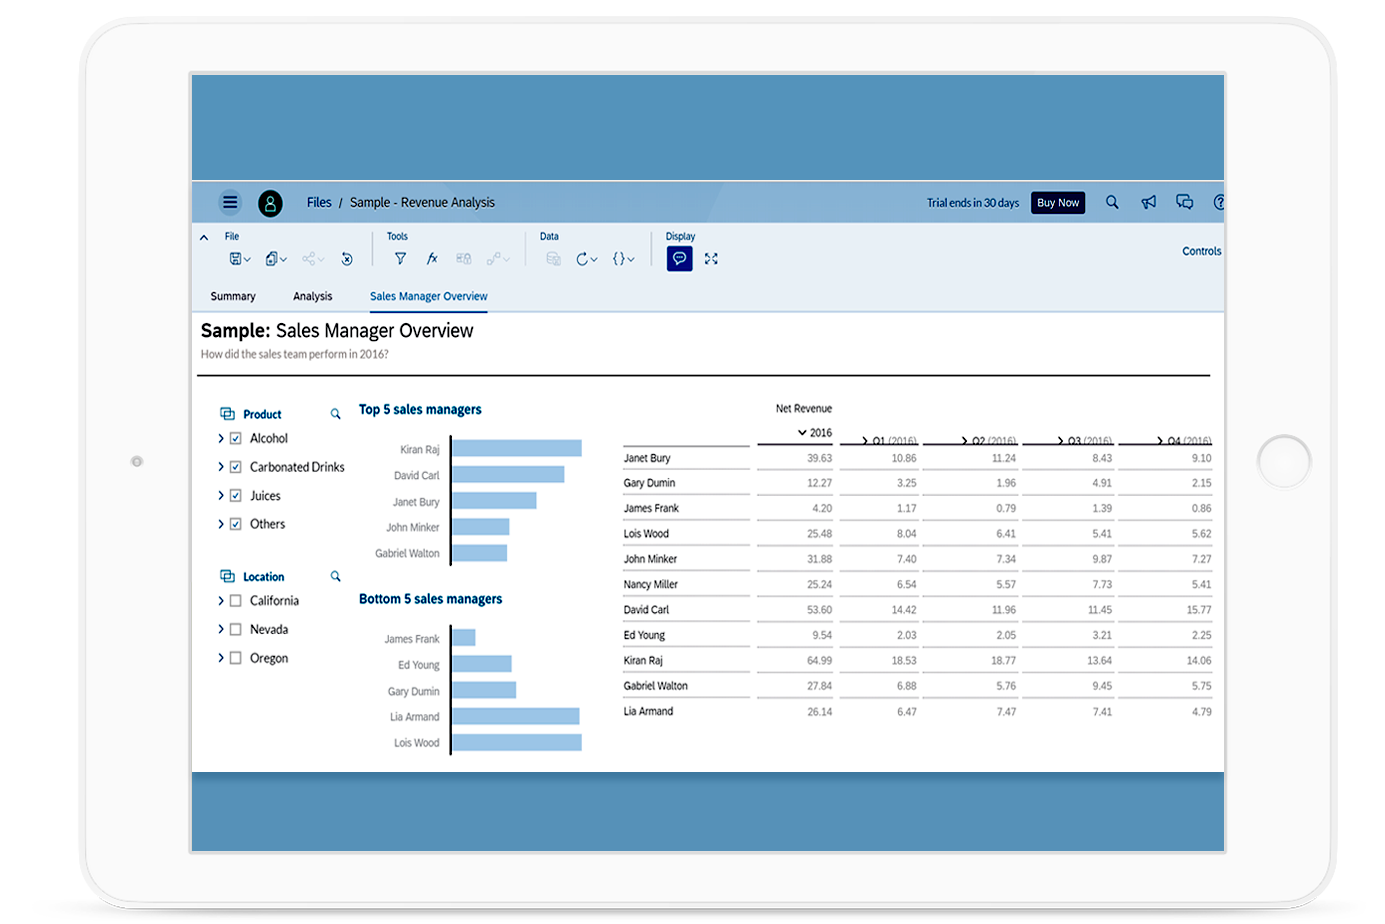
Via this interactive experience I could easily vary the products and locations on the left-hand side of the screen to review my top and bottom five sales managers. This simple interaction easily allowed me to identify top performers and specific revenue numbers, all whilst staying on the same dashboard (i.e. Kiran Raj sells the most alcohol – 10.91 M to be exact).
It was fun playing with the fictional beverage company and having access to all different kinds of data, although my favorite kind of data is related to Human Capital Management and Payroll.
As discussed in a previous blog, SAP SuccessFactors is moving toward a solution for all Human Capital Management reporting and analytics to exist in SAP Analytics Cloud (SAC). In the meantime however, we all know that reporting on the transactional Payroll and/or Time and Benefits data is a challenge within any solution, as discussed here.
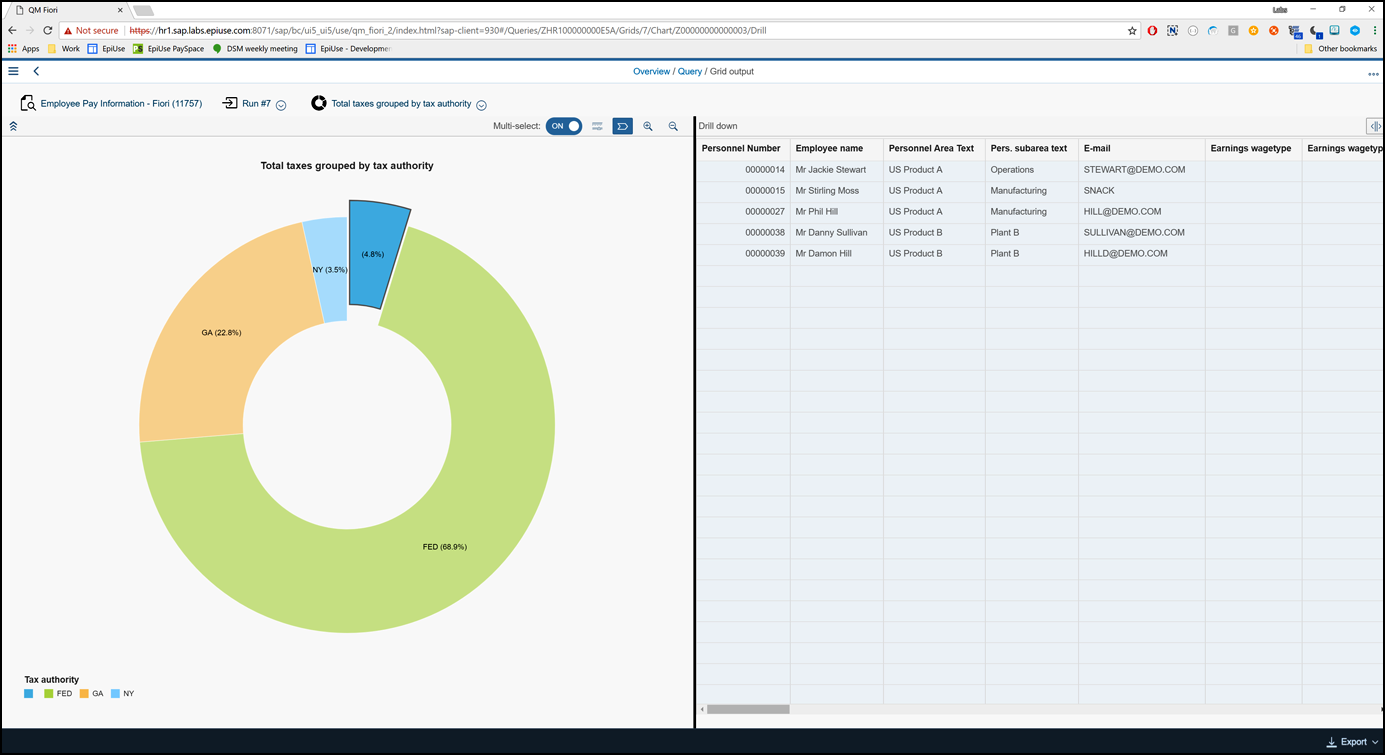
Did you know that EPI-USE Labs Query Manager customers have access to Payroll, Time and Benefits data, leveraging Fiori, today?
The Query Manager Fiori interface allows you to access your reports from anywhere – you don’t have to be logged into a computer with SAP GUI installed. You can run and process reports from web browsers, mobile devices, self-service portals, HR Renewal portals or even from within SAP SuccessFactors Employee Central.
The Fiori app allows you to create charts and graphs for additional interaction, drill-down, and analysis. Whether you are creating an executive dashboard or monthly employee productivity reports, you can now visualize your data and transform it into a coherent and meaningful presentation.
See samples below: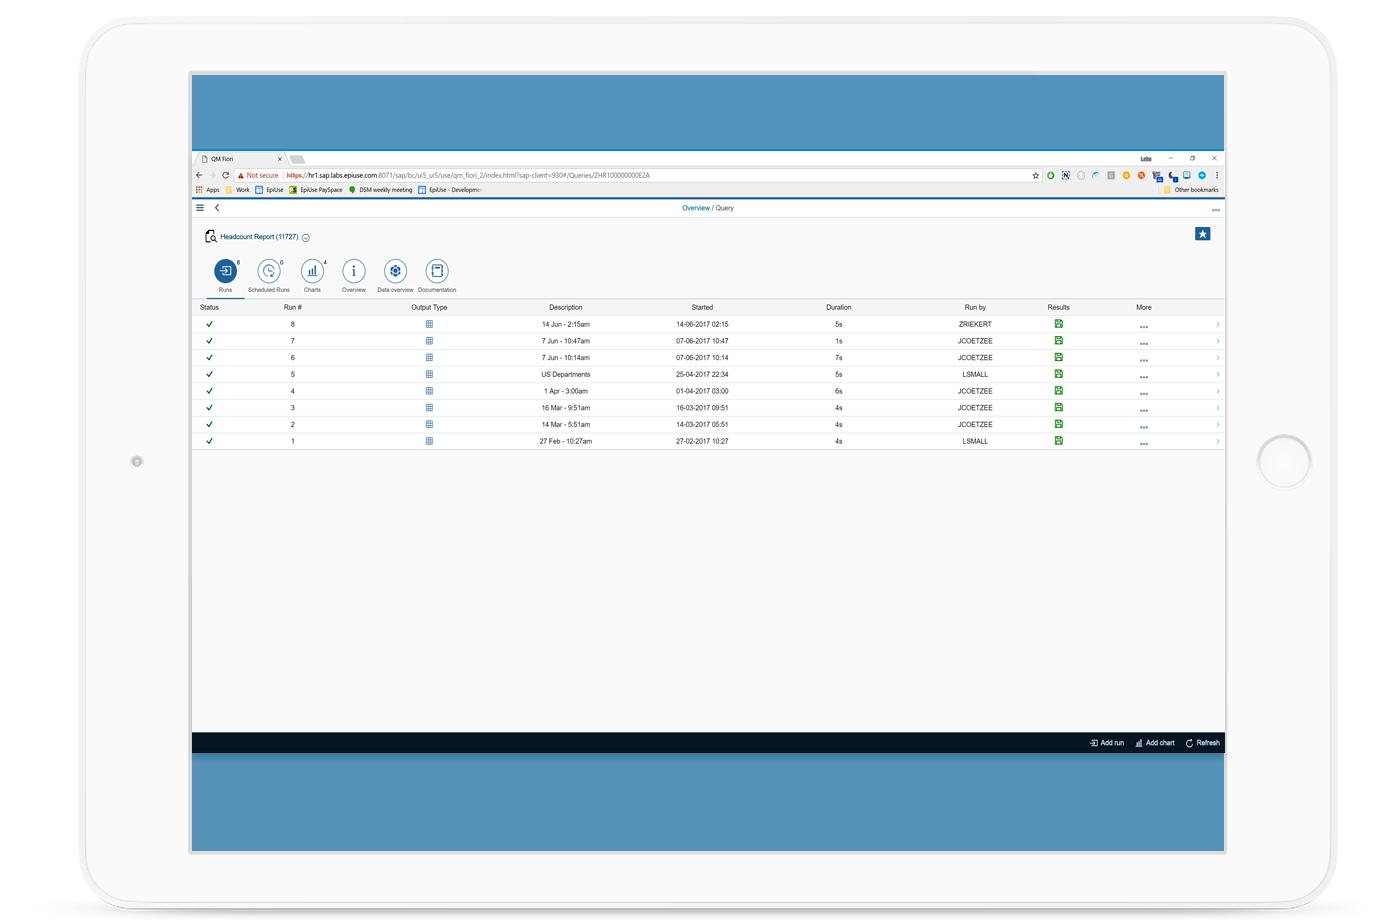 Sample of Query Manager Fiori app showing delivered content
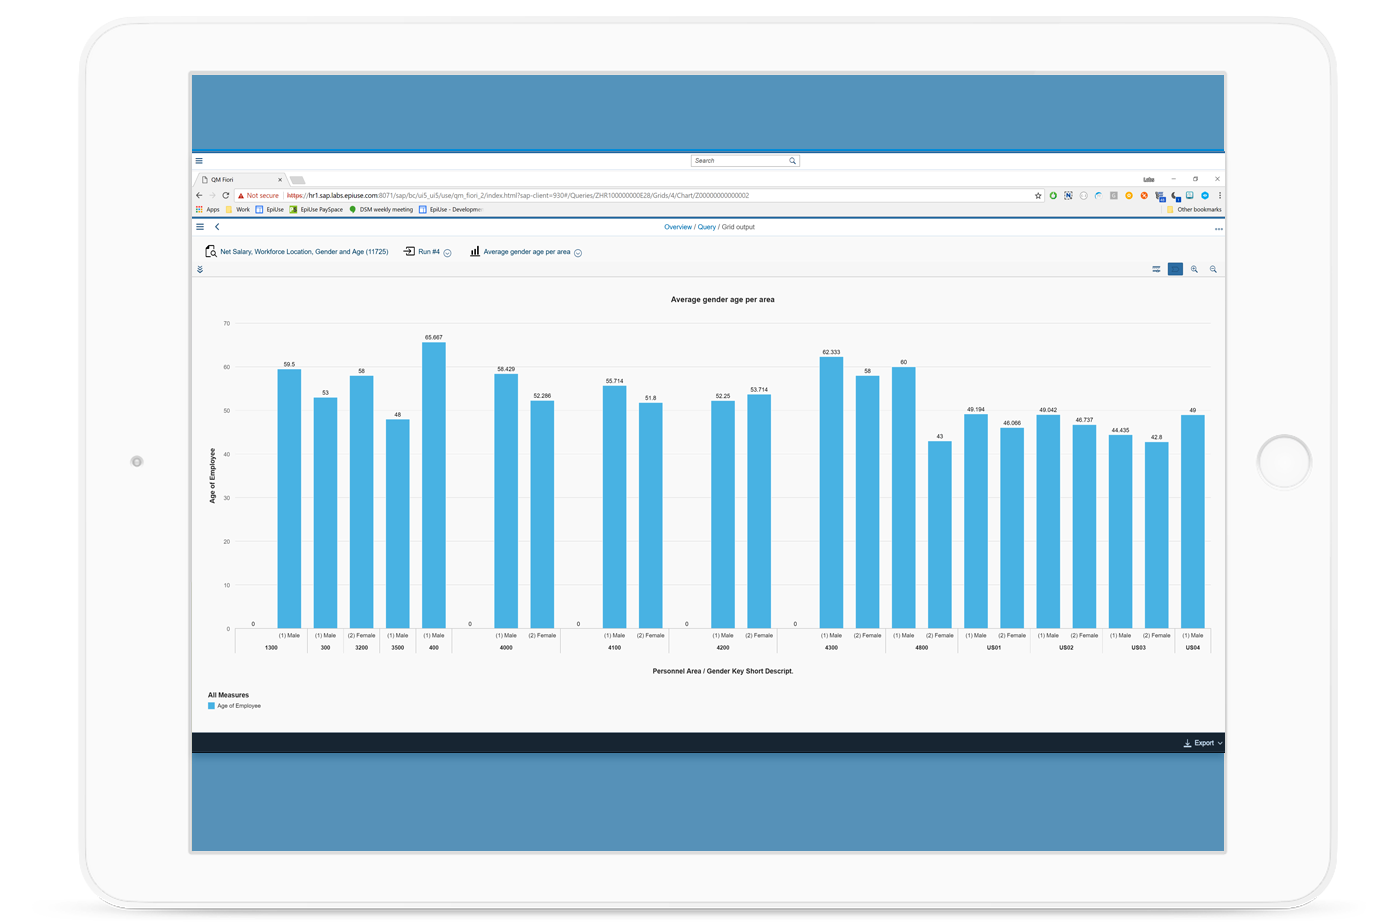 Sample of Query Manager Fiori app showing an interactive bar chart analyzing gross, net and tax thresholds
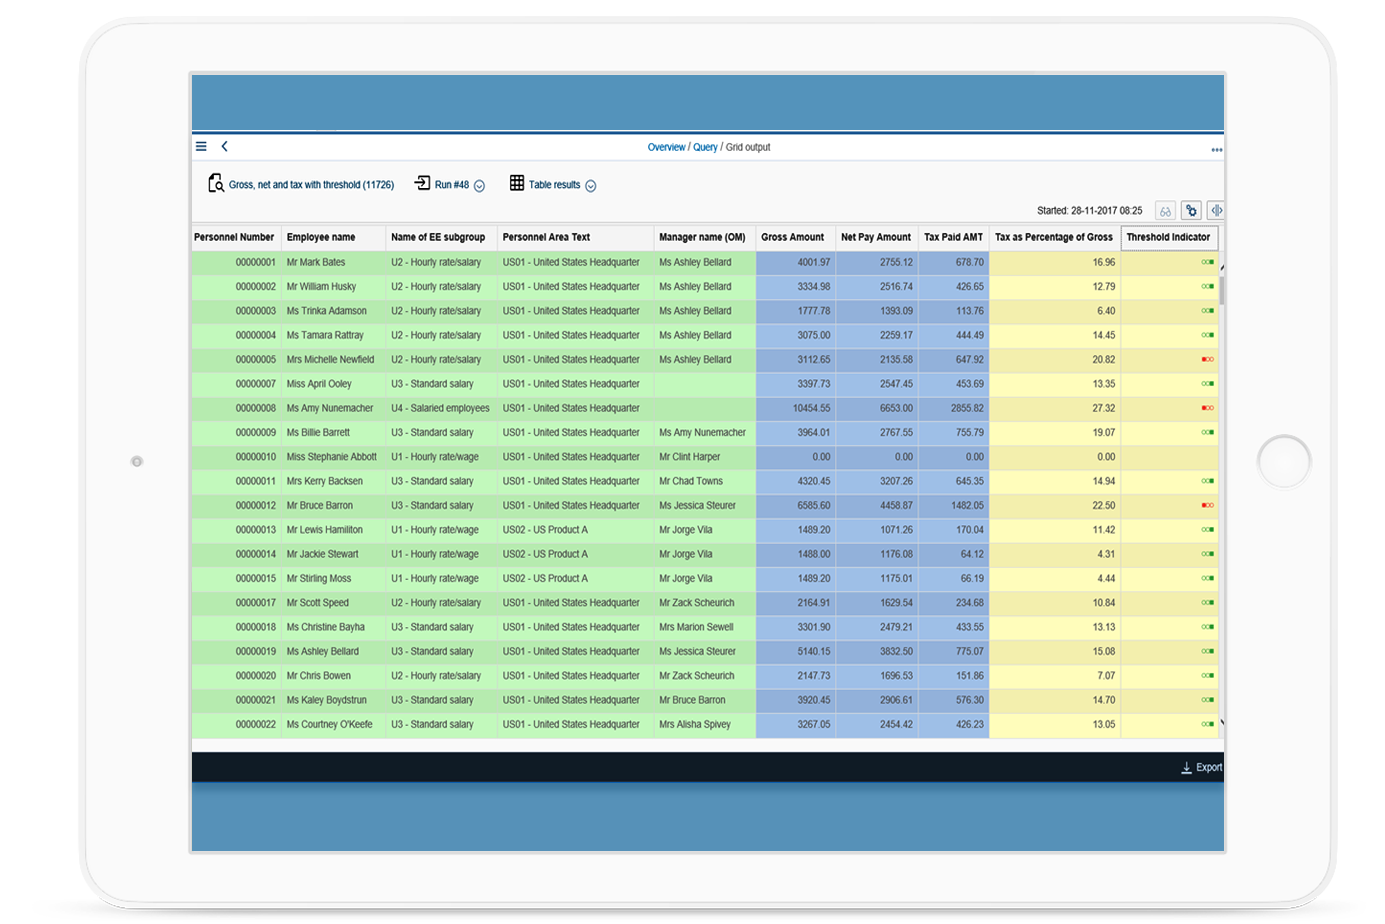 Sample of Query Manager Fiori app drill-down into raw data for gross, net and tax Payroll data
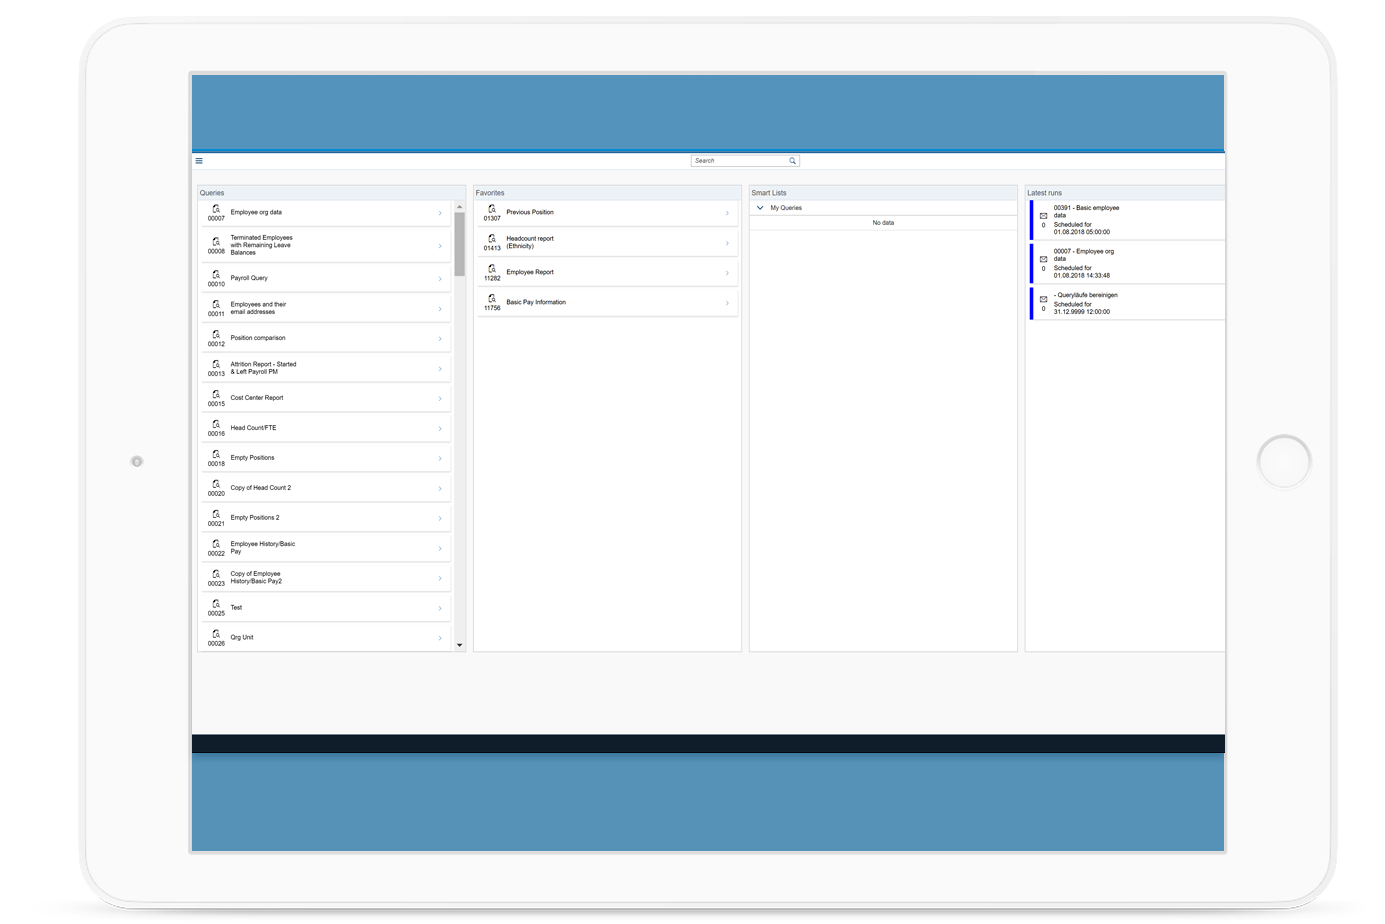 Sample of Query Manager Fiori App
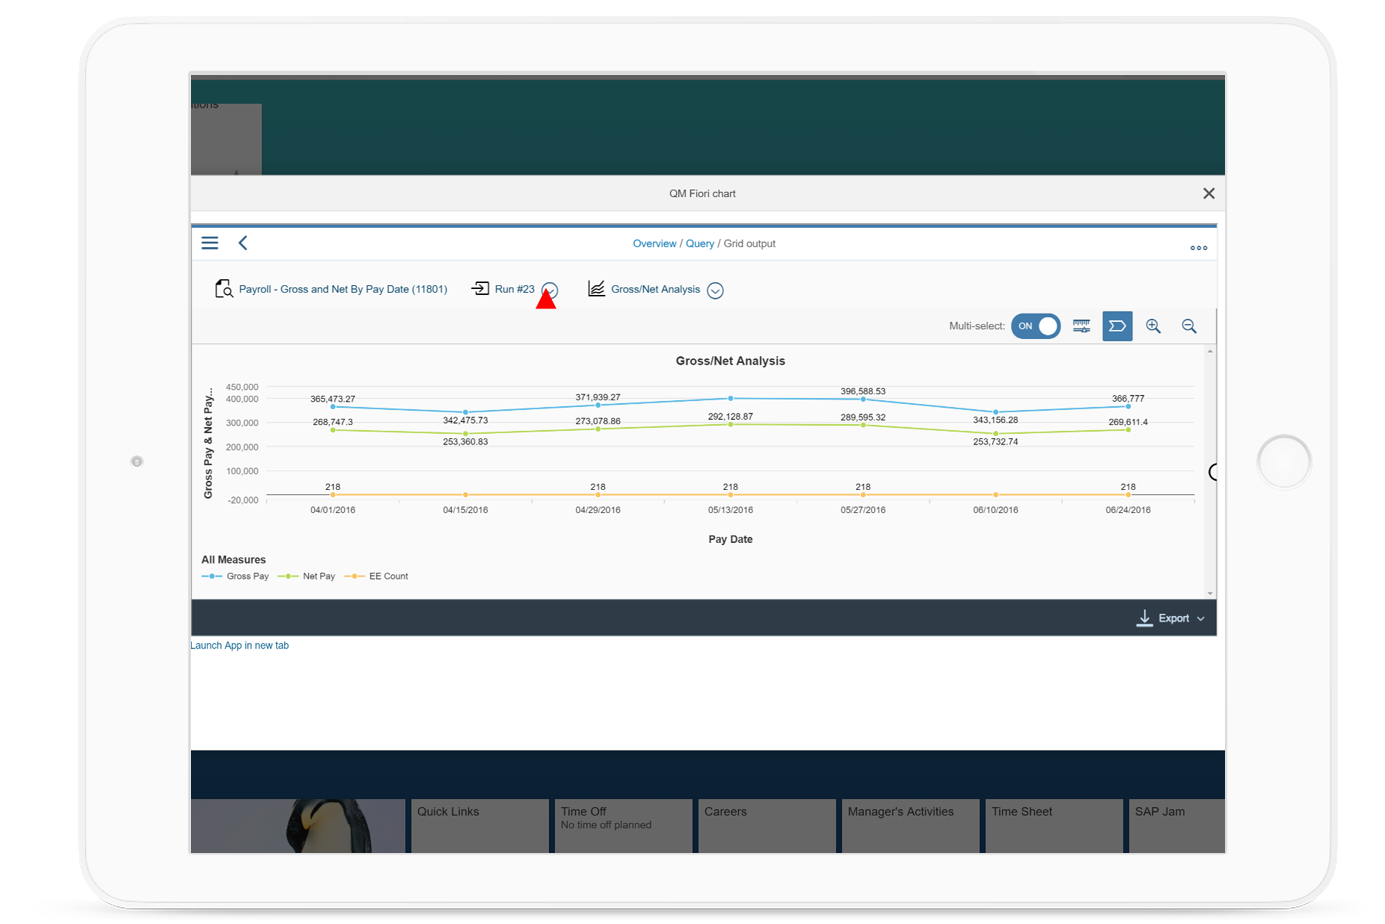 Sample of Query Manager Fiori app accessible through SAP SuccessFactors Homepage
 Above and below: Sample of Query Manager Fiori app showing how the screen can display multiple charts and graphs at a time for maximum analysis.