Our recent webinar explained how Query Manager can be used to feed data to Analytics systems. One of the webinar attendees queried if this could be used to help HR teams identify employees most impacted by the COVID-19 pandemic. Our first blog on this subject explains how you can take advantage of the data released by reputable sources, including governmental authorities and global organizations such as the WHO, to do this yourself.
There are many additional use cases for leveraging the data shared by these organizations in tandem with your Human Resources data. Another example is determining the outstanding cost for your organization of all employees wishing to take or receive funds for their earned leave to date. This is often referred to as Leave Liability Reporting. You can leverage geo data for where your employees may be most vulnerable geographically; you can also analyze factors such as demographics, age, gender and ethnicity to create reports that could look at the financial impact for those employees.
COVID-19: Leave Liability Reporting
Many organizations rely on Leave Liability reporting to identify trends in absence, and for costing purposes. These reports evaluate liability and absence history, and are calculated to help with administration of employee absences and leave. During this difficult time, determining the outstanding employee leave balance can be crucial. For example, should you be forced to pay out the outstanding leave for an entire department, you’ll need to know what the cost will be.
In the example below, we have combined the critical geographical data from published COVID-19 cases and used it with various Analytics solutions to help you easily review leave balances, and the financial impact to your company, based on the escalation of the virus and how your business may be impacted. Below are the instructions on how we did so.
Accessing COVID-19 data
A simple Google search will allow you to download geographical statistics including samples like these: OCHA, the New York Times and JHUCSSE. Many provide a download file (or a dynamic service) that includes geographic information (latitude and longitude or region, zip code, country etc.), the number of cases, and confirmed deaths and recoveries, similar to the sample below.
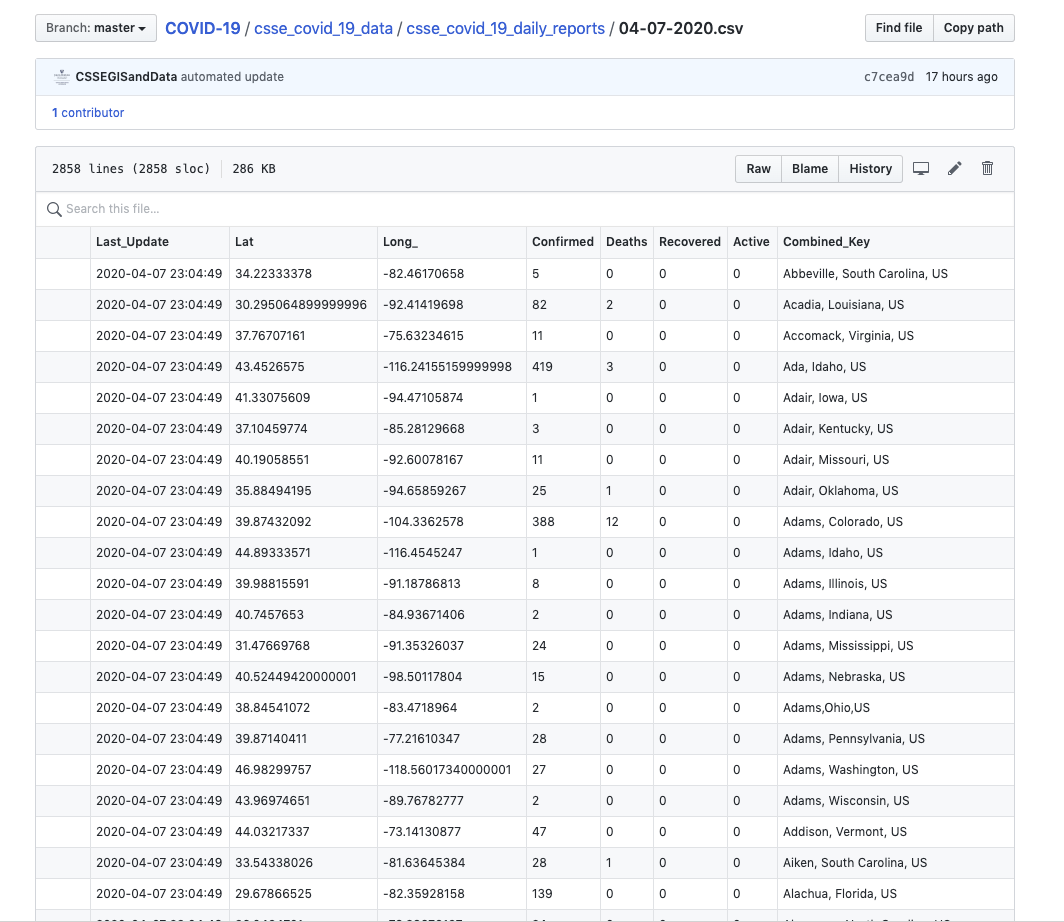 © GitHub
Import or link the data with your Analytics solution
This data can be imported or linked with your Analytics solution (Microsoft PowerBI, SAP Analytics Cloud, Tableau etc.) and visualized in various outputs such as a geomap, table or graph.
Query Manager provides your live employee data
Using Query Manager, you can then link your live employee data from your SAP HCM or SAP SuccessFactors Employee Central Payroll system to the Analytics solution, as follows:
- You create a Query Manager report, in this example the Leave Liability report, that includes all of the data you wish to include, via the easy drag-and-drop interface.
- You then use the Analytics Connector to dynamically share that data with your Analytics system, without replicating or staging the data, even for sizable volume.
- The Query Manager Analytics Connector generates a web service that exposes that data as an OData service that you can then consume via your Analytics solution (like Microsoft PowerBI or Tableau).
In the example below, we integrated SAP Payroll data with geo data in SAP Analytics Cloud to detail Leave Liability, leveraging SAP SuccessFactors SAP Analytics Cloud Smart Insights.
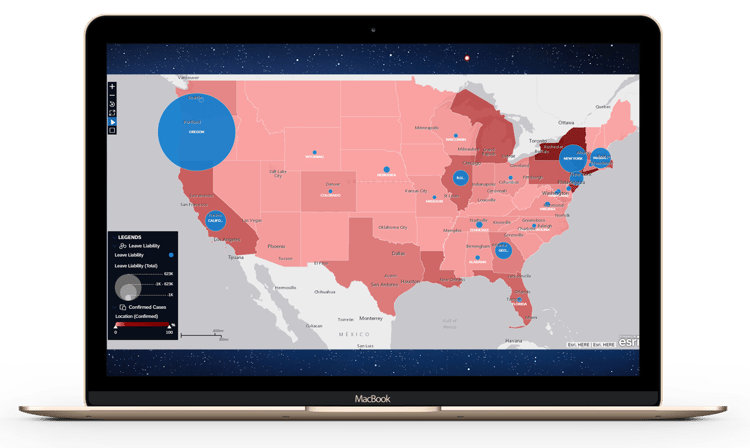 © EPI-USE Labs
Please contact me if you'd like to discuss how we can help you in any way during this difficult time.