Analyze data in SuccessFactors EC and ECP: An SAP Payroll analyst’s dashboard

July 15, 2021
Written by Paul Lamonica

Paul is a Senior Solutions Architect, responsible for training of all EPI-USE Labs HCM products. He also works on new customer demos and national webinars hosted by EPI-USE Labs.

With many SAP payroll customers moving to the cloud for their HR needs, it has become apparent that differences in Employee Central (EC) data and Employee Central Payroll (ECP) data or on-premise SAP payroll data, are causing payroll analysts additional time-consuming work when trying to determine the out-of-sync conditions between the two systems. While there are existing reporting capabilities in both EC and ECP, each of them on their own do not often satisfy the requirements analysts require. And what’s even worse, the reports are created separately, containing data from their respective systems, which then calls for extra steps by the analysts to marry the reports together to find where data is inconsistent.


This is where a product like EPI-USE Labs’ Query Manager™ can provide payroll analysts with a method to report on both EC and ECP data together within one report. And, the report can easily highlight where data is different between the two systems.

To demonstrate Query Manager’s capabilities, let’s use an example that is most likely one that payroll analysts would find realistic in their data validation routine.


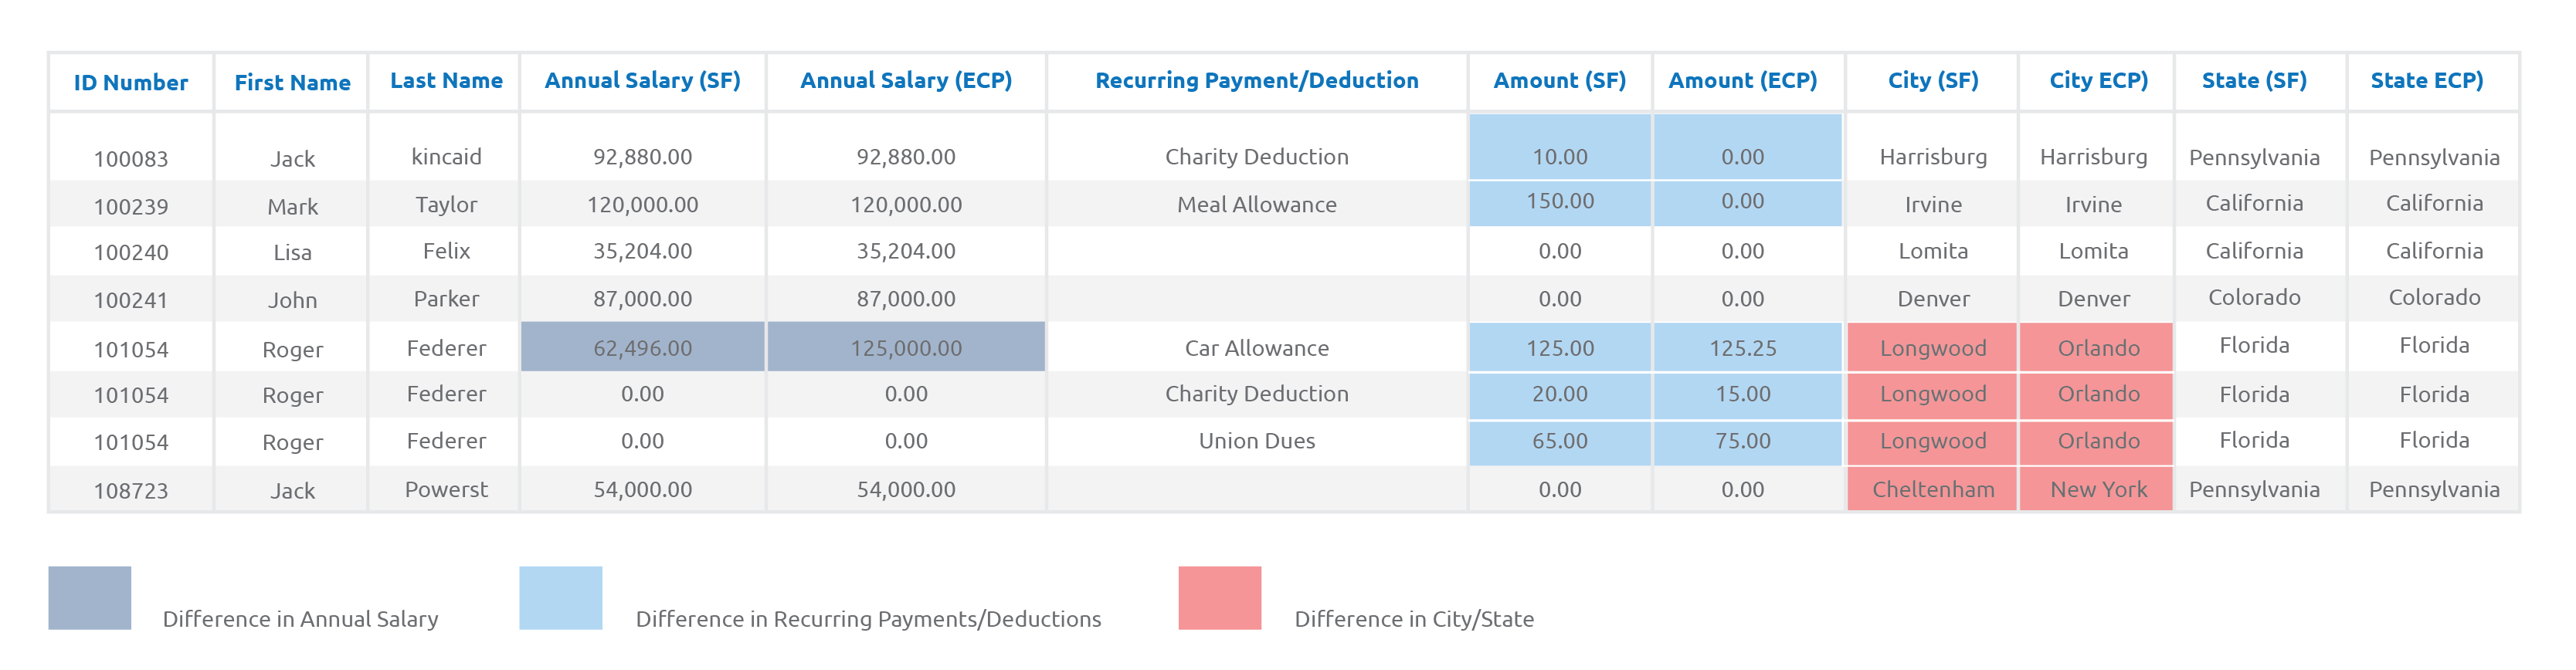
Prior to the next pay cycle to be executed, it’s imperative to check that the following data elements are in sync between EC and ECP:

  • Annual Salary
  • Recurring Payments and Deductions
  • City and State of Residence (for tax calculation purposes)

Here is a report created through Query Manager that has retrieved data from EC and ECP in real time, and has quickly and easily highlighted differences with respect to these three types of payroll-related data:

QM Report

Now that the data has been combined from the two systems and the differences identified, what’s next?


Although creating this report is the crucial first step, we can’t stop here. We need to get answers to the following three questions for the creation of this report to be beneficial:

  • How can the report be available to the payroll analysts who need it?
  • How can the data be refreshed so that the analysts are always looking at current results?
  • How can the results be displayed in different ways, providing the payroll analyst with different views into the results?

EPI-USE Labs has also solved these issues with the use of our Query Manager Analytics Connector, and with a little help from one of the many visualization tools that exist, such as Microsoft’s Power BI, Tableau, or SAP Analytics Cloud. While any of the visualization tools will work with the Query Manager Analytics Connector, in this blog we will be using Microsoft Power BI as our chosen tool.


EPI-USE Labs’ Analytics Connector allows the results of your Query Manager query to be available to the visualization tool, where the data can be turned into a variety of output types that makes the analysis of the data very user-friendly. And maybe one of the most important points of all: the whole process can be automated and scheduled, so there is no manual intervention within the process.


Here is a typical process flow:

  • Schedule the Query Manager query to be run automatically every day at 7:00 a.m. This functionality exists directly within Query Manager. Data has now been combined from EC and ECP, and the discrepancies have been identified.
  • Schedule your Power BI refresh to kick off automatically every day at 7:30 a.m. This is standard functionality with Power BI and is very easy to set up. Power BI now recognizes the most current results obtained from the Query Manager query, using the Query Manager Analytics Connector as the gateway between Power BI and the Query Manager query results.

It’s that simple. Those two easy steps have now allowed the payroll analysts who need to view and resolve the data discrepancies to see the most current results within Power BI. Also, they can see the results in a variety of ways that makes it very easy to know the next steps to take.


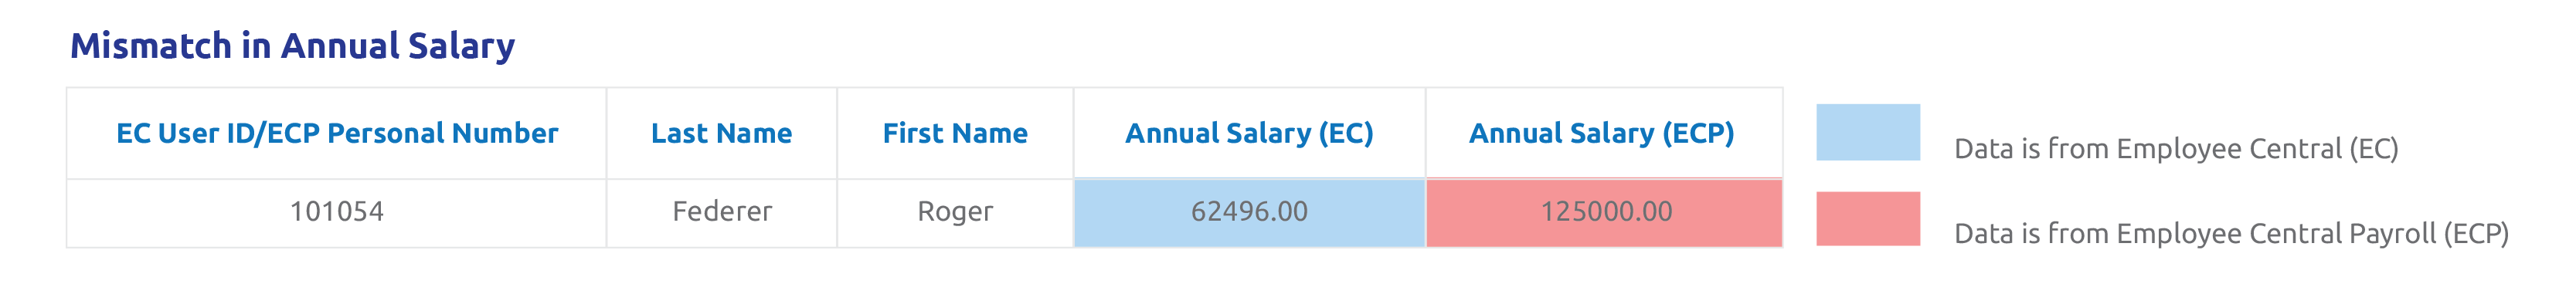
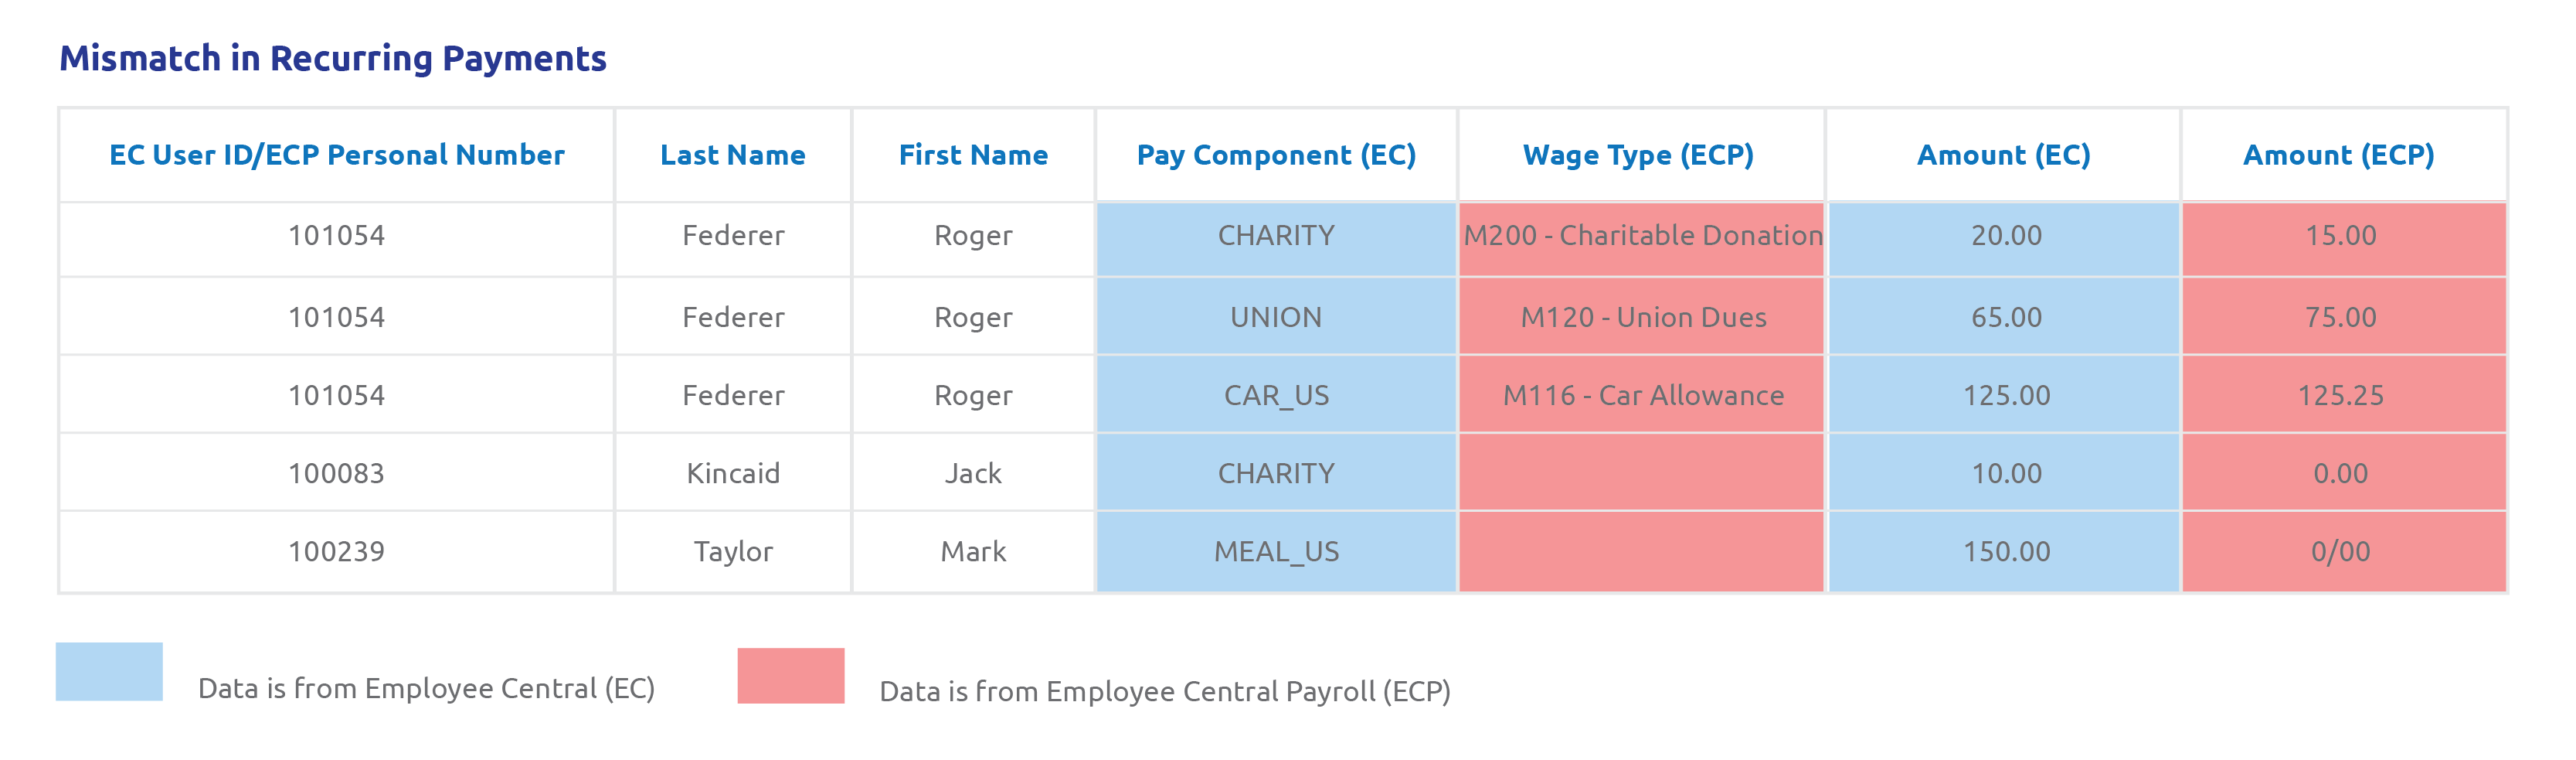
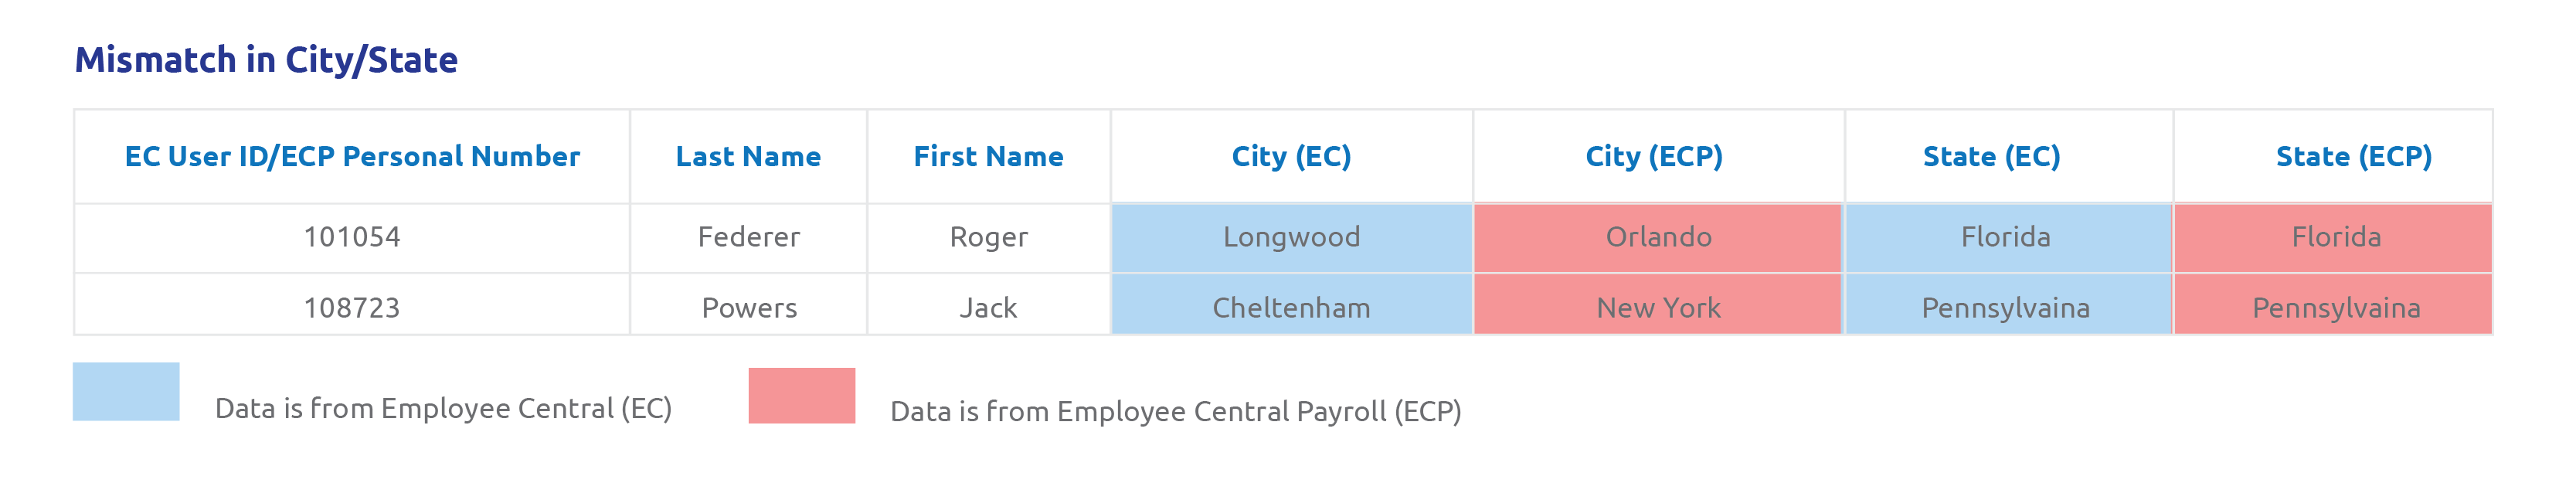
Here are just a few of the many ways to display the data differences within Power BI.
First, separate reports can be created that show the discrepancies for each of the payroll-affecting areas being interrogated. Naturally, each of these reports can be downloaded into something like a Microsoft Excel® spreadsheet, if the user prefers to use the data in that way:

Mismatch in annual salary

Mismatch in recurring payment

Mismatch in city

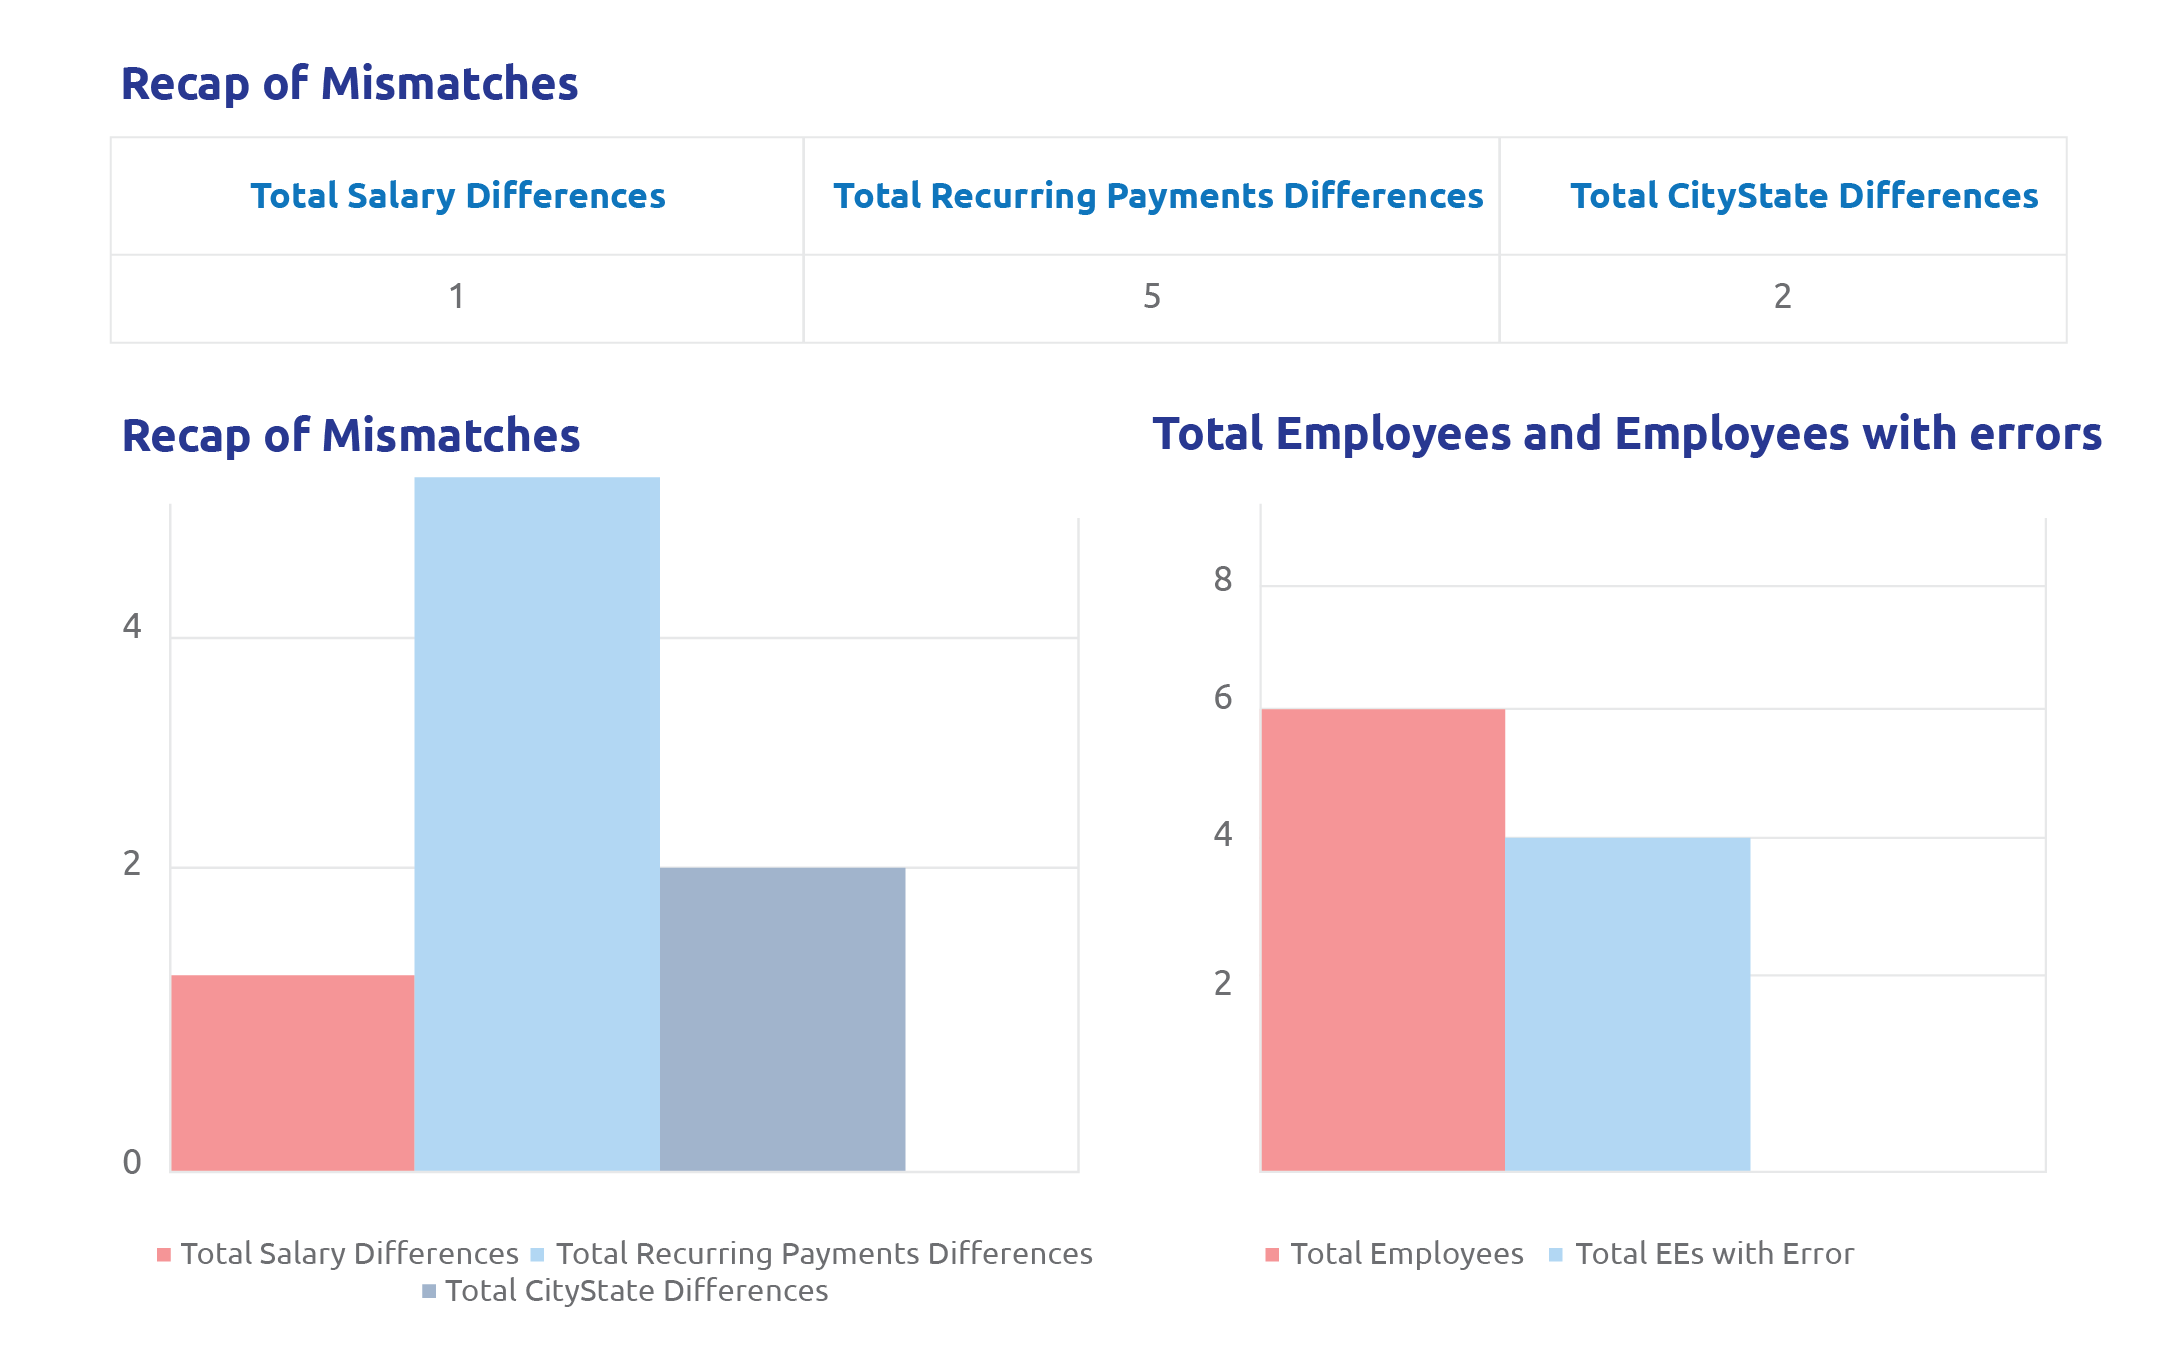
Next, the results can be displayed in a summarized fashion.

The first two reports show the number of differences for each of the areas being checked, while the third report simply shows the total number of employees on the reports, and the number of employees who have at least one discrepancy.

The great part of the detail reports and the summarized reports is that they are showing the discrepancies that exist within the EC and ECP systems using constantly refreshed data. And, the reports were created automatically with no manual intervention.

Recap of mismatches

Whenever the same type of data exists in more than one system, the possibility for data discrepancies can always occur. For years, having automated processes that can report and identify these data differences has always been a challenge. And the distribution and refreshing of those reports with current results has never been a smooth process. But now, with the use of EPI-USE Labs’ Query Manager and Query Manager Analytics Connector, along with the use of one of the many visualization tools, the completely automated process of getting this vital information into the hands of the users who need them has been significantly simplified.


New call-to-action


Explore Popular Tags

Query Manager SAP SuccessFactors SAP HCM reporting HCM Reporting SAP HCM SAP Reporting SAP Payroll HCM SAP SuccessFactors Employee Central Payroll SAP SuccessFactors Reporting EPI-USE Labs reporting PRISM Payroll Document Builder Payroll reporting Query Manager Analytics Connector SAP Analytics Cloud SAP HCM Data SAP Query Microsoft PowerBI SAP SuccessFactors People Analytics Human Capital Management (HCM) Intelligent HR and Payroll SAP Payroll data Variance Monitor HR and Payroll data Tableau HXM Move Payroll Data SAP HCM Payroll SAP S/4HANA SAP S/4HANA Private Cloud Edition (S/4 PCE) people analytics sap query hr Data Sync Manager Employee Central Payroll Journey to SAP SuccessFactors SAP SAP ERP HCM SAP HCM On-Premise Solutions SAP HCM journey SAP HR Reporting SAP HXM SAP and SuccessFactors HXM Reporting COVID-19 Cloud-based SAP HCM solutions Employee payroll HCM Productivity Suite HR SAP HCM/HXM SuccessConnect reporting solution ABAP DSM for HCM Employee Central Payroll Reporting Employee data GeoClock H4S4 Let's Talk HCM PRISM for HCM (Private Cloud Edition) PRISM free assessment Pay Recon SAP Data Warehouse Cloud SAP HCM Analysis SAP SuccessFactors HCM Journey SAP SuccessFactors Roadmaps SAP data privacy and compliance SuccessFactors Ultimate Guide: SAP HCM & Payroll Options data validation payroll control center Data Sync Manager for HCM Employee Central GDPR HCM, HR OData Query Manager with Document Builder Real-time reporting and document creation SAP Analytics Cloud (SAC) SAP HCM On-premise SAP HCM for SAP S/4HANA On-Premise SAP HR SAP On-Premise customers SAP Payroll to the Cloud SAP Road maps SAP customers SAP data SAP data privacy & security Success Factors SuccessConnect 2019 Tax Reporting Transformation without re-implementation accurate payroll data certification custom infotype data source ebook on-premise SAP HCM s/4HANA Analytics solutions Automated reports Automation Cloud migrations DSM Object Sync for SuccessFactors Hybrid Data Secure Data Types Data analysis Digital tranformation EPI-USE Labs’ solutions Employee Letters Employee communication Free HCM Assessment HR Journey HR employee reports Human Resources Human Resources data Hybrid Reporting SAP and SuccessFactors Hybrid SAP and SuccessFactors Hybrid reporting Hybrid reporting solution Integrated reporting SuccessFactors SAP Intelligent Enterprise Microsoft Excel News OData integration OM Object Sync On-Premise Payroll On-Premise Payroll S/HANA Sidecar On-premise reporting Organization of the data PA People Analytics Workforce Planning Personalized documents Protect personal employee data Report Stories Reporting and analysis Robotic Process Automation (RPA) Robotic Process Automation framework S/4HANA Private Cloud Edition (PCE) SAP Data Privacy Suite SAP Data Security SAP ERP Payroll customers SAP HCM 2023 SAP HCM Roadmap SAP HCM and Payroll customers SAP HCM for S/4HANA SAP HXM 2021 SAP Mentors SAP SuccessFactors Hybrid SAP SuccessFactors Next-Gen Payroll SAP SuccessFactors Release updates SAP SuccessFactors Time Management SAP SuccessFactors Time Tracking SAP Wage Type Reporter SAP certified solution SAP migration SAPPHIRE 2018 SuccessFactors and the Intelligence Enterprise SuccessFactors' Employee Central Payroll TCO Calculator The Report Center The Road to People Analytics Time management Workforce Planning ad hoc data variances easy reporter high-speed, low-risk on-premise SAP data partner roadmap single reporting solution sq01 stories in SAP SuccessFactors People Analytics technology third party ALE STP report ASUG Accessing COVID-19 data Ad Hoc Query American Payroll Association (APA) Analytics Connector Analytics reports Analytics solution Artificial Intelligence (AI) At-risk employees Australian Payroll Australian Tax Office (ATO) Automated analysis and pay run reconciliations Automatic HR reports Best practice in BI Bots Business Analytics Business Intelligence COVID-19 statistics COVID-19 vaccinations Certified solutions ChatGPT Check for data replication errors Client Sync Cloud hosting SAP PCE Company Branding Compare legacy HR and Payroll data Comparing data Configuration Center Copy and mask test data Coronavirus Created timestamp Custom store Customer-specific infotypes DSAG Data Privacy Data Replication Data Sources Data Sync Manager (DSM) Data access Data privacy regulations Data production support issue solution Democratize data Description Diversity & Inclusion reporting DocuSign Document Building Dynamic data ECC EPI-USE ERP Education sector Electronic Signatures Embedded Analytics Edition Employee Central time Employee Central timesheets Employee NICs Employee Retention Analytics (ERA) Employee payment summaries Employee right to privacy Employer NICs Encrypt data FAQ Index Font Guidelines Gender Pay Gap General Data Protection Regulation Governance, Risk Management and Compliance (GRC) Government forms Grid control Grid layout HANA HCM Client Sync™
+ See More

Get Instant Updates


Leave a Comment: